The Six Demand-Side Drivers Behind Every PE Exit Multiple
Oct 01, 2026
The most useful private equity question is also the least asked.
Operators spend their time on what they will build. Funds spend their time on what they will measure. Almost no one spends time on the question of what the buyer will actually pay for.
The short answer
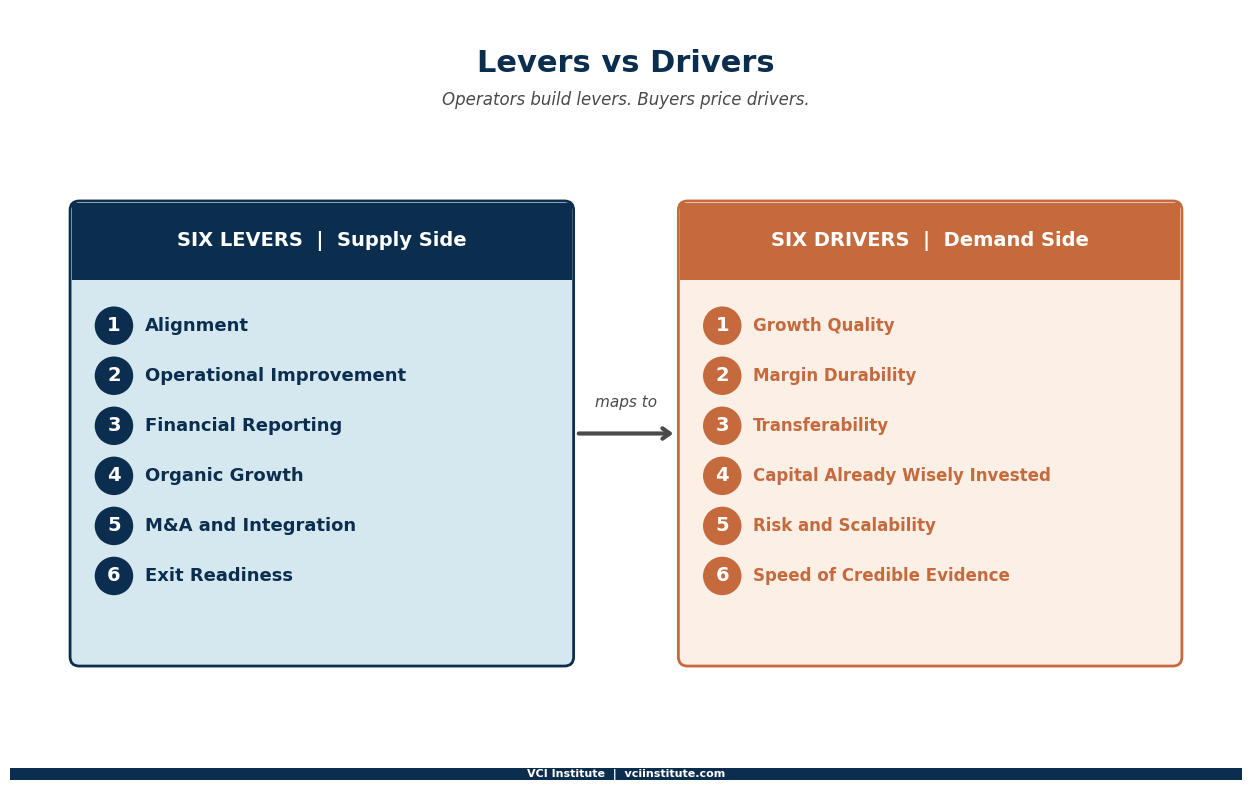
Levers are supply side, what the operator builds. Drivers are demand side, what the buyer prices. The six drivers are growth quality, margin durability, transferability, capital already invested wisely, risk and scalability, and speed of credible evidence. Most value creation plans connect levers to EBITDA and stop. The plan that produces a premium exit maps each lever to the drivers it moves and treats EBITDA as a proxy rather than a destination. Operators build EBITDA. Buyers pay for confidence. Same EBITDA, different multiple.
Levers and drivers are not the same thing.
Levers are what funds and operators build inside the company. Alignment, operational improvement, financial reporting, organic growth, M&A, exit readiness. Six of them, in roughly the order that matters. Most VCII frameworks live here, and they should. This is the supply side of value creation.
Drivers are what buyers price when they look at the company at exit. Growth quality, margin durability, transferability, capital already invested wisely, risk and scalability, and speed of credible evidence. Six of these too, mapping to the questions a sophisticated buyer asks before assigning a multiple.
Most value creation plans connect the levers to EBITDA and stop there. The plan that produces a premium exit connects the levers to the demand-side drivers, and treats EBITDA as a proxy, not a destination.
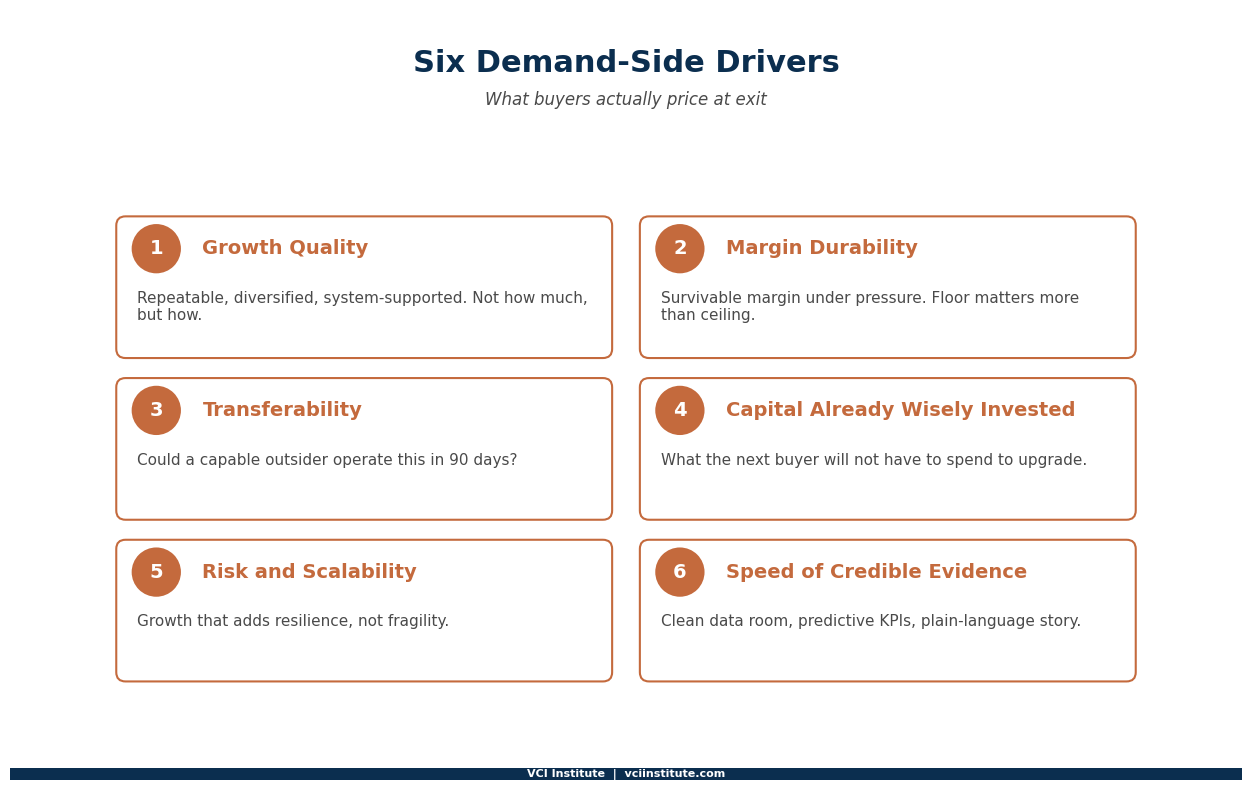
The six demand-side drivers behave very differently from the six levers, and understanding the difference is the difference between a five turn exit and a seven turn exit on the same EBITDA.
Growth quality. Not how much you grew, but how. Repeatable, diversified, system-supported growth pays a premium. Concentrated, lumpy, hero-dependent growth pays a discount, even at the same growth rate. The buyer is not buying last year. They are buying the next four. They will pay a multiple based on how much they believe last year will repeat. This is where the real concentration picture becomes a pricing input rather than a diligence footnote, because a buyer who maps beneficial owners will find what the top ten chart conceals.
Margin durability. Not how high your margins are, but how survivable. A 22 percent EBITDA margin in a tailwind year prices below an 18 percent margin in a year with two visible headwinds and no margin compression. The buyer is pricing the floor, not the ceiling. Operators tend to optimize for peak margin and miss that peak margin in a benign year is a flat circle on the buyer's curve. Margin built on demonstrated pricing power reads as durable. Margin built on a cost cycle does not.
Transferability. The single most underweighted driver in operator thinking. The question the buyer is silently asking is whether a capable outsider could operate this business inside ninety days. If the answer requires the founder, the answer is no, and the multiple drops. The driver is not whether the founder is good. The driver is whether the company runs without them. This is the exit-side price of the problem described in diligence the system, not the resume, and the next buyer will diligence it the same way you should have.
Capital already invested wisely. Buyers discount businesses that visibly need reinvestment after acquisition. The CRM that has not been upgraded. The ERP that is two cycles behind. The factory that has been deferred for three years. Each of these is priced into the bid as a future capital outlay, and the company sits at the wrong end of that calculation. Operators who treat reinvestment as a value creation lever and not a cost center exit on better terms. Technology spend in particular has to be argued in enterprise value terms, which is the work in the digital EBITDA bridge.
Risk and scalability. Growth that adds fragility is discounted. Growth that adds resilience is priced. The buyer is not asking how fast you grew. The buyer is asking what broke when you grew. Operators who scale gracefully through stress events show up cleanly here. Operators who only scaled in benign conditions do not.
Speed of credible evidence. The driver almost no one talks about explicitly, and the one that quietly determines the auction dynamics. Buyers pay more for companies whose value creation evidence is delivered fast, with high signal, and with low friction. The data room is clean. The KPIs are explainable. The leadership team can articulate the drivers in plain language without referring to the deck. This driver is what allows the auction to compress, the bidders to lean in, and the multiple to expand.
The mapping between the six levers and the six drivers is not one-to-one, and treating it that way is a common operator mistake.
The alignment lever moves transferability and speed of credible evidence. Not directly, but powerfully. A company that runs on shared vocabulary and clear decision rights tells its story faster and looks more transferable to the buyer. Without alignment, every other lever produces evidence that is harder for a buyer to absorb. The mechanism that produces that shared vocabulary is the Thesis Operating System, running from the IC memo down to the weekly rhythm.
The operational improvement lever moves margin durability and capital already invested wisely. The improvements that compound over years pay back at exit because the buyer sees the durable margin, not just the current margin. The improvements that were one-time price moves wash out.
The financial reporting lever moves speed of credible evidence and transferability. Operators routinely under-invest here because the lever does not show up in EBITDA in the next quarter. It shows up in the auction, when the company that has clean, predictive KPIs runs a forty-five day diligence and the company that does not runs a ninety-day diligence with a price chip at the end. The prerequisite is that the functions agree on the numbers at all, which is the single source of truth audit.
The organic growth lever moves growth quality and risk and scalability. Growth done through a system pays a multiple. Growth done through a single rep, a single channel, or a single geography does not. The lever is not how much you grew. The lever is how diversified the engine became while you grew.
The M&A lever moves growth quality and capital already invested wisely. Add-ons that integrate cleanly compound the multiple. Add-ons that integrate poorly destroy it, even when they grew the EBITDA, because they reveal a non-transferable execution profile.
The exit readiness lever moves all six drivers, which is why it is the lever most operators underweight. Treating exit readiness as a year-four project is the most common reason a strong operating year produces a soft exit. The lever has to run from year one to compound.
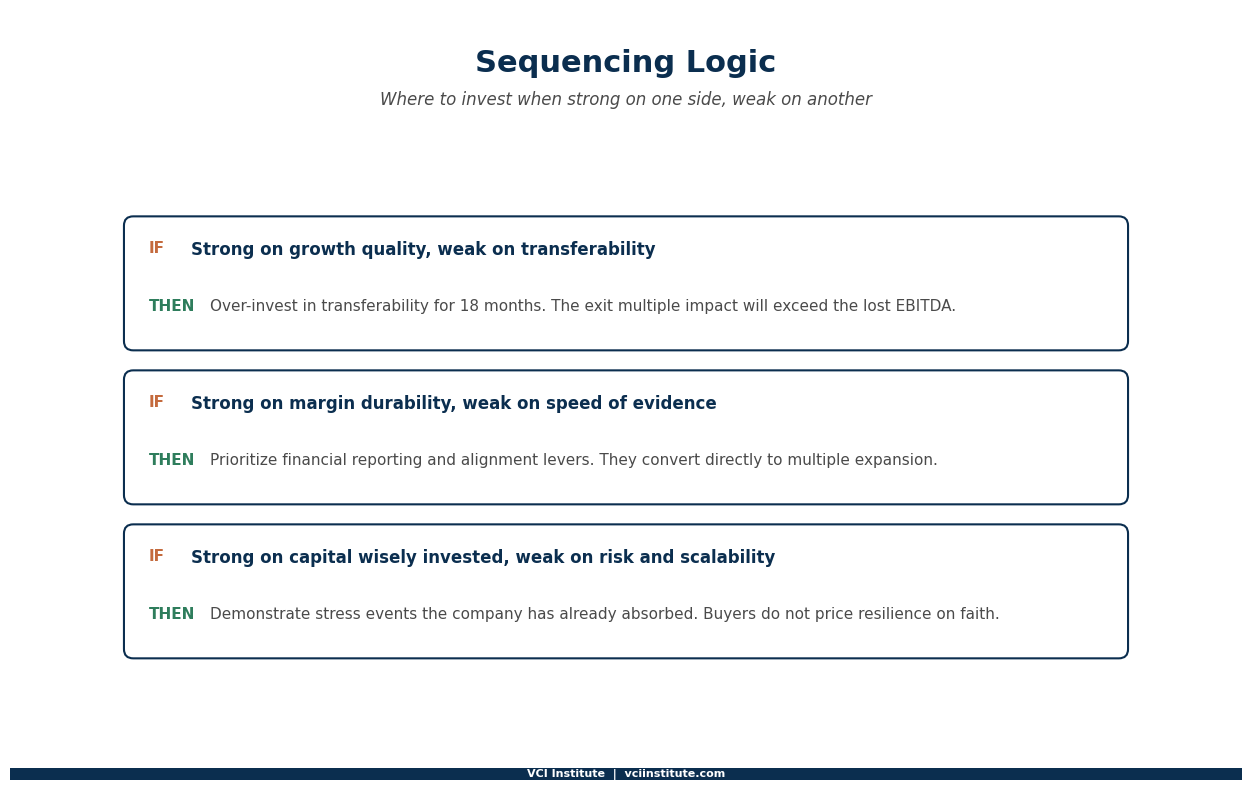
The matrix produces a sequencing decision that pure lever thinking does not.
If your company is strong on growth quality but weak on transferability, your value creation plan should over-invest in transferability for the next eighteen months, even at modest cost to growth. The exit multiple impact will be larger than the lost EBITDA.
If your company is strong on margin durability but weak on speed of credible evidence, your priority is the financial reporting lever and the alignment lever, in that order, because both convert into multiple expansion the operator cannot otherwise generate.
If your company is strong on capital already invested wisely but weak on risk and scalability, your priority is to demonstrate stress events that the company has already absorbed, because that is the only way a buyer prices resilience without taking it on faith.
The mapping is uncomfortable for funds because it pulls value creation work toward levers that do not produce immediate EBITDA. The reward is at exit, in the multiple, where the largest dollars in private equity actually live.
The frame we keep coming back to is that operators build EBITDA, and buyers pay for confidence. The six levers build EBITDA. The six drivers build confidence. A value creation plan that treats the two as the same activity will produce a clean operating year and a disappointed deal partner at exit.
A value creation plan that treats them as two coordinated activities, with the lever-to-driver mapping made explicit, produces a different exit. Same EBITDA. Different multiple. The difference is the work nobody asked the operator to do, that the buyer paid for anyway. That gap matters more than usual in a market where roughly half of mid-market volume is sponsor to sponsor, and the buyer across the table runs the same playbook you do.
CEVP: Certified Exit Value Practitioner
The demand side, taught as a discipline
CEVP is built entirely on the question this article opens with: what the buyer will actually pay for. Eleven modules, nine bonus units, three checkpoints and seventeen interactive instruments you run on a real company. One case business followed across thirty three months, then an unaided capstone on a second. The output is an exit readiness plan sorted by lead time, which names plainly what cannot be fixed in the time remaining.
VCI Institute in collaboration with Mohamad Chahine
Published 1 October 2026
Related reading from the VCI Institute
The Sponsor-to-Sponsor Trap
What the buyer on the other side is thinking when they run the same playbook you do.
Diligence the System, Not the Resume
Why transferability is a system property, and how the next buyer will test it.
Pricing Power as the First-Order Lever
The margin question most models miss, and the difference between durable and cyclical margin.
About the VCI Institute
The VCI Institute is a nonprofit dedicated to building practical capability and shared standards for value creation in private equity. The Institute publishes operator-grade frameworks and runs certification programmes for operating partners, portfolio company executives, and value creation analysts. You can see what each programme actually covers before deciding. Analysis published here draws on the Institute's certification curricula and on structured review of mid-market transaction patterns rather than on any single proprietary dataset. Where a figure is directional rather than measured, it is described as such.
Further material is available in the Institute's Insights library and its free resource library of templates, checklists, and case snapshots.
© 2026 VCI Institute. All rights reserved. The frameworks, terminology, and analysis presented in this article are the intellectual property of the VCI Institute. Reproduction or derivative use without written permission is prohibited. Citation with proper attribution is welcomed.
We have many great affordable courses waiting for you!
Stay connected with news and updates!
Join our mailing list to receive the latest news and updates from our team.
Don't worry, your information will not be shared.
We hate SPAM. We will never sell your information, for any reason.


 Practice private equity like a pilot trains